
The definitive guide to JavaScript Debugging
Co-Founder, @CreoWis | Teacher, @tapaScript | Founder, @ReactPlay | YouTuber | Writer | Human
Originally published at Bugfender
Introduction
As developers, we’ve traditionally rooted out errors in our programs (we’ll call them bugs from now on if that’s ok) by using meaningful log statements. JavaScript has the famous console.log() method for that.
But while log statements are good, they are less efficient than a tool that enables you to carry out step-by-step debugging. So in this article, we will learn how to use Google Chrome developer tools (also known as DevTools) to debug any JavaScript application effortlessly.
One of the great things about using DevTools is that other browser vendors (like Firefox and Microsoft) provide their own tools to debug a JavaScript application, and they work in a similar way. So once we’ve learned how to use the debugging tool for one browser, it’s easy to use for another.
What are we debugging today?
Take a look at the Greet Me app. This JavaScript app asks for your name and invites you to submit a ‘wish’, which will be used to deliver your own personalized greeting.
Figure 1: The Greet Me app showing an error
But wait, there’s a problem here. The greeting message doesn’t print the wish part correctly. It inserts a rogue word, NaN. Thankfully, Chrome DevTools will enable us to identify the issue.
If you want to try out the tips provided below, you can find the Greet Me app at https://greet-me-debugging.vercel.app/. You can also clone the app code from GitHub and run it locally.
Know about the Sources panel
DevTools provides a lot of different tools to perform debugging tasks, including DOM inspection, profiling, and network call inspection. But the one we’re interested in right now is the Sources panel, which helps us in debugging JavaScript.
You can open DevTools by pressing the F12 key or using a shortcut: either Control+Shift+I (Windows, Linux) or Command+Option+I (Mac). Click the Sources tab to navigate to the Sources panel.
Figure 2: Opening the Sources Panel
The Sources panel has three primary sections.
Figure 3: Sources Panel sections
File Navigator Section: All the files that our Greet Me page requests are listed here.Code Editor Section: When you select a file from the navigator pane, the content of the file will be listed here. We can also edit the code from here.Debugger Section: You will find lots of tools available here to set breakpoints, inspect variable values, watch for changes, etc.
If your DevTools window is wide or undocked in a separate window, the debugger section will be displayed to the right of the Code Editor pane.
Figure 4: DevTool window is wide open
Set up breakpoints
To start debugging, the first thing to do is to set breakpoints.
Breakpoints are the logical point you want the code execution to pause so that you can debug it.
DevTools allows you to set breakpoints in many different ways. As we start debugging our application, we will learn how to set them…
- At the line of code.
- At conditional statements.
- At the DOM node.
- On Event listeners.
Set breakpoints at the line of code
To set a line-of-code breakpoint:
- Click the Sources tab.
- Browse the source file from the File navigation section.
- Go to the line of the code in the Code Editor section on the right.
- Click on the line number column to set a breakpoint on a line.
Figure 5: Set a line-of-code Breakpoint
Here we have set a breakpoint at line number 6. The code execution will be paused here.
Tips: Use this when you do not know the exact region of the code to investigate. Even if you just start from somewhere, based on a guess, it will lead to the bug eventually. You can also set up multiple line-of-code breakpoints and investigate. We will see that in the latter part of the article.
Set a conditional breakpoint
To set a conditional breakpoint:
- Click the Source tab.
- Browse the source file from the file navigation section.
- Go to the line of the code in the code editor section on the right.
Right-click on the line number and select the Add conditional breakpoint option.
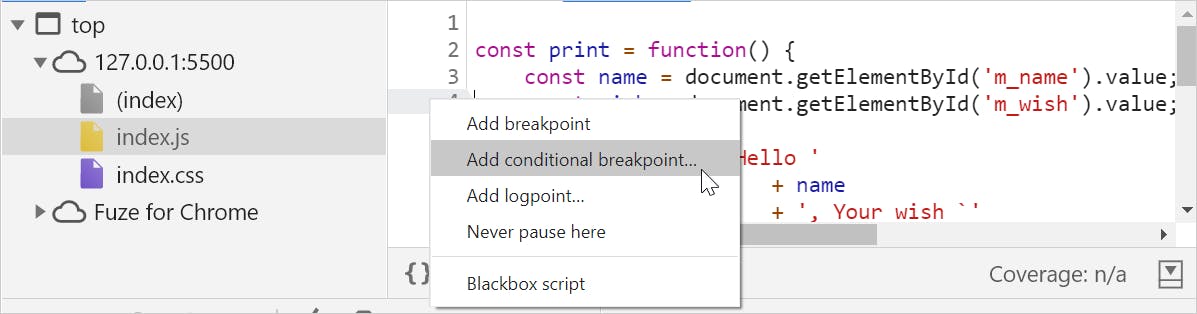 Figure 6a: Right-click on the line number
A dialog box appears below the line of code. Start typing the condition. As you type, you will see the autocomplete option suggesting you pick up a condition.
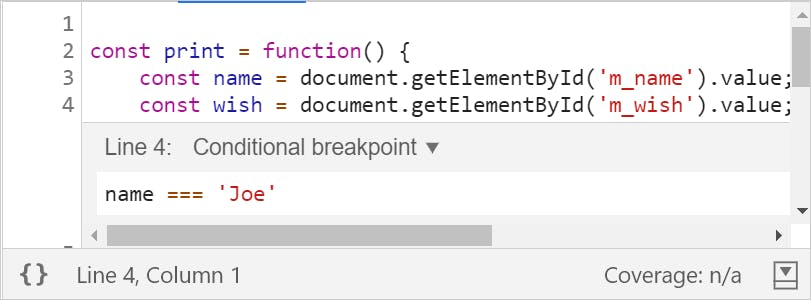 Figure 6b: Enter a condition
Press Enter to activate the breakpoint. You should see an orange icon appear on top of the line number column.
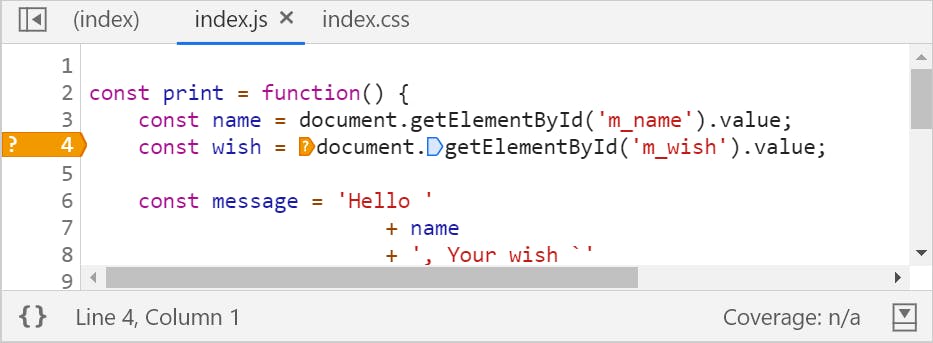 Figure 6c: A conditional breakpoint has been activated
The code execution will be paused whenever the function print() is invoked with the name Joe.
Tips: Use the conditional breakpoint when you know the specific region of code to investigate. As you may be aware of the region of the code, you can inspect further using conditions to find the root cause of the problem.
Set breakpoint on event listeners
To set a breakpoint on event listeners:
- Click the
Sourcestab. - Expand the
Event Listener Breakpointspane in thedebugger section. Select the list of event listeners from the category list to set breakpoints. We have a button click event in our application. We will be looking to select the
clickcheckbox under themouseoption.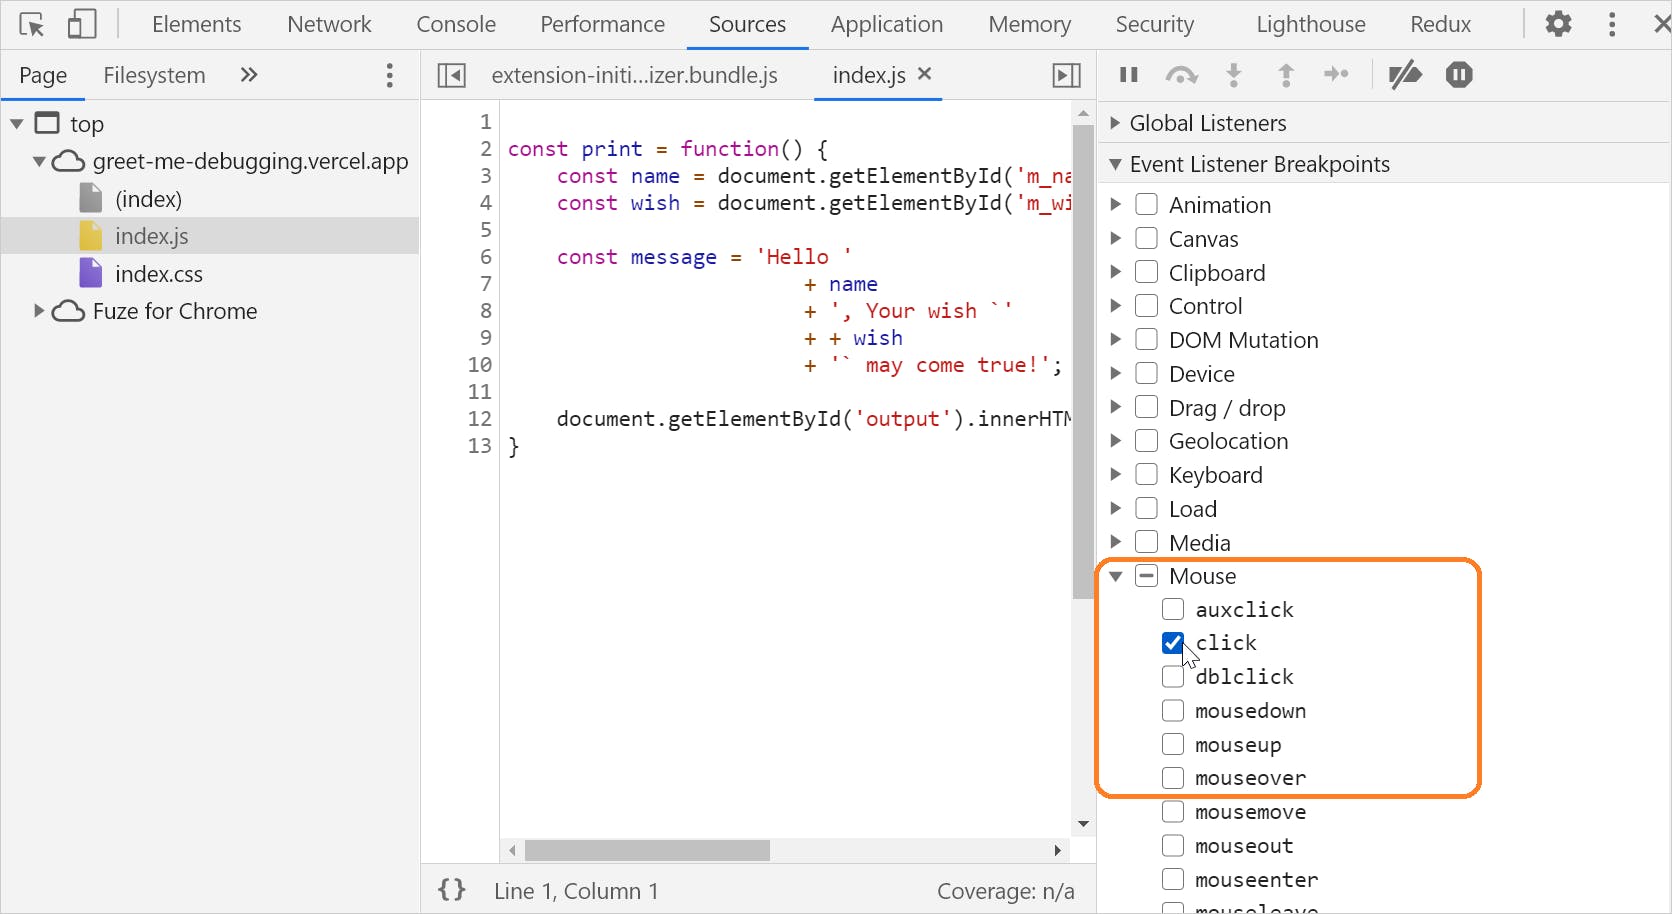 Figure 7: Set a breakpoint on the click event listener
Tips: Use this when you want to pause the event listener code that runs after an event is fired.
Set breakpoint at the DOM node
DevTools is equally powerful when it comes to DOM inspection and debugging. You can set breakpoints to pause a code execution when something is added, removed or, changed in the DOM.
To set breakpoints on DOM change:
- Click the
Elementstab. - Go to the element that you want to set the breakpoint on.
Right-click on the element to get a context menu. Select
Break onand then select one of theSubtree modifications,Attribute modifications, orNode removal.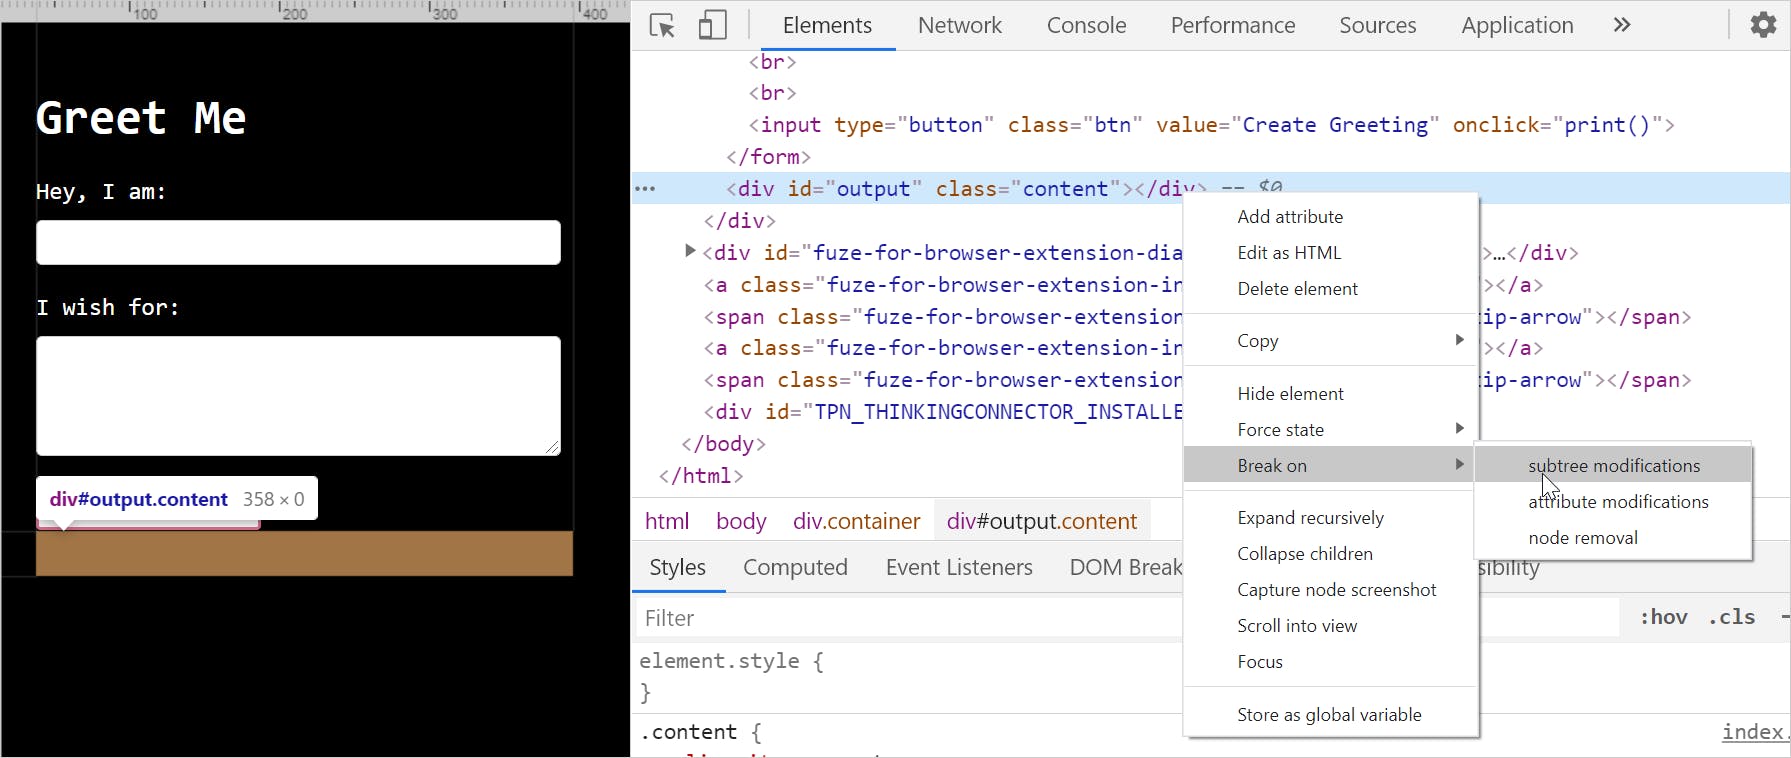 Figure 8: Adding a breakpoint on the DOM change
As you see in the above figure, we are setting a breakpoint on the DOM change of the output DIV with a condition of Subtree modifications. We are aware that a greeting message will be added into the output DIV and the subtree will be modified to break on it.
Tips: Use this when you suspect a DOM change is causing the bug. The related JavaScript code execution will be paused automatically when it breaks on the DOM change.
Step through the Source Code
Now we know all the important methods to set breakpoints. In a complex debugging situation you may have to use a combination of them. Let us see how to step through the breakpoints to figure out an issue.
The debugger section provides five controls to step through the code.
 Figure 9: Step through controls
Step(Key shortcut – F9)
This option enables you to step through line by line as the JavaScript code executes. If there is a function call on the way, the step-through also gets inside the function, executes it line by line, and then steps out of it.
Figure 9a: Performing step line-by-line
Step Over (Key shortcut – F10)
This option allows you to execute a function without stepping into it. Occasionally, you may be certain that some functions are working properly and not want to spend time inspecting them. In this situation, you should use the step over.
In the example below, we are stepping over the logger() function.
Figure 9b: Step Over the function
Step Into (Key shortcut – F11)
Use this option to investigate a function in greater depth. When stepping through, you may have the feeling that a function is behaving unexpectedly and want to inspect it. Use step into to get inside the function and debug.
In the example below, we are stepping into the function logger().
Figure 9c: Step into the next function call
Step Out(Key shortcut – Shift + F11)
While stepping through a function, you may not want to continue and come out of it. Use this option to step out of a function.
In the example below, we are stepping inside the logger() function and then stepping out of it immediately.
Figure 9d: Step out of the current function
Resume/Jump (Key shortcut – F8)
At times, you may want to jump from one breakpoint to another without debugging any code in between. Use this option to jump to the next breakpoint.
Figure 9e: Resume or Jump to the next breakpoint
Inspect Scope, Call Stack, and Values
When you step through the lines to debug, you can inspect the scope and the value of the variables and the call stack of the function calls.
Scope
You can use this to find out what is in the global scope and what its variables are, using the scope panel. You can also find out the value of the this keyword.
Figure 10a: Scope panel
Call Stack
The call stack panel helps to identify the function execution stack.
Figure 10b: Call stack
Values
Inspecting values is the primary way to identify a bug in the code. When stepping through, you can inspect a value simply by doing a mouseover on a variable.
In the example below, we are selecting the variable name to inspect its value at the code execution stage.
Figure 10c: Inspect a value with mouseover
Additionally, you can select a section of the code as an expression to check the value. In the example below, we have selected an expression document.getElementById('m_wish') to inspect the value.
Figure 10d: Inspecting value of an expression
Let’s Watch
The Watch section enables you to add one or more expressions and watch their values at execution time. This feature is very useful when you want to do some computation outside your code logic.
You can combine any variables from the code region and form a valid JavaScript expression. At the time of stepping through, you will be able to see the value of the expression.
Here are the steps required to add a Watch:
Click on the + icon above the Watch section
 Figure 11a: Add a watch expression
Add an expression to watch. In this example, we have added a variable wish to watch its value.
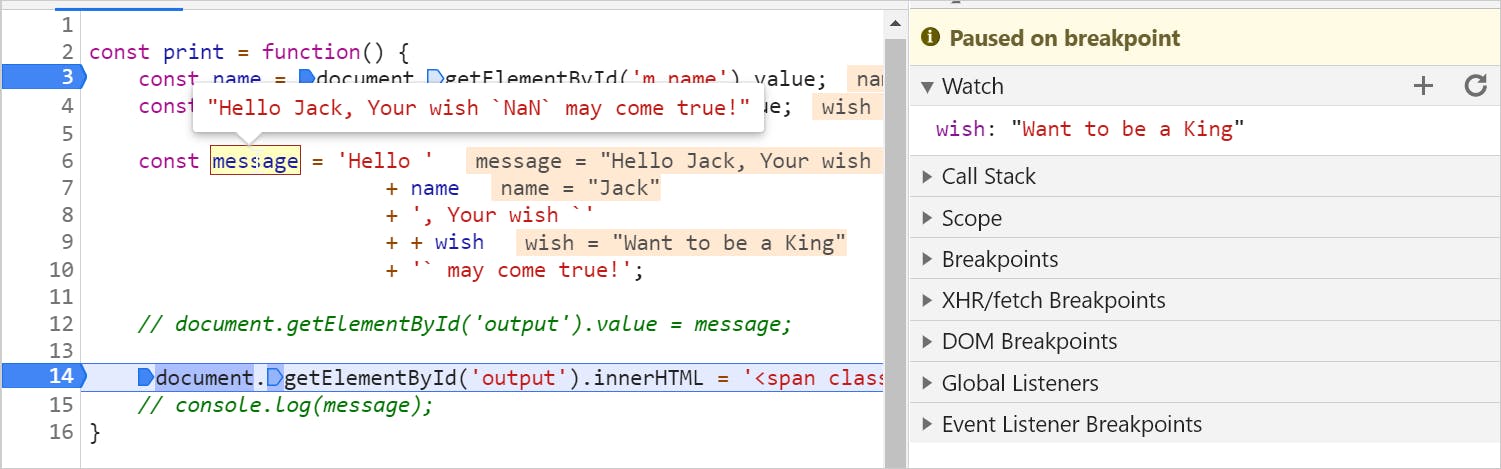 Figure 11b: Watch expression value
Another way to watch for an expression is from the console drawer. See the example below to know how to activate it.
 Figure 11c: Activate the console drawer
Disable & Remove Breakpoints
To disable all the breakpoints at once, click on the Deactivate Breakpoints button(it is circled below.)
Figure 12a: Disable all breakpoints
Please note, the above method doesn’t remove the breakpoints. It just deactivates them for the duration you require. To activate the breakpoints, please click on the same button again.
You can remove one or more breakpoints from the Breakpoints panel by unchecking the checkboxes. You can remove all the breakpoints permanently by doing a right-click and selecting the option, Remove all breakpoints.
Figure 12b: Remove one, more, or all the breakpoints
Finally, The Fix
With all that we have learned so far, what do you think is the fix to make the Greet Me app functional as expected? Have you figured that out already?
In case not, it’s just that extra + before the wish variable while constructing the message.
// This is the line where the issue is.
// Identify the extra '+' before the wish.
const message = 'Hello '
                        + name
                        + ', Your wish `'
                        + + wish
                        + '` may come true!';
How would we find that in a realistic debugging scenario? Have a look at this short video demo(without audio),
JS Debugging: Greet Me app Fix
You can also play around with the fixed version from here.
Debug JavaScript with Visual Studio Code
What’s your favorite code editor? Personally, I like Visual Studio code because of its simplicity. We can enable a similar kind of debugging environment using VS Code with just a few simple steps.
VS Code setup for debugging
VS Code has several extensions (like plug-ins) for enabling various features and capabilities. To enable JavaScript debugging, you need to install an extension called Debugger for Chrome. You can install it in either of these ways:
- Go to the Debugger for Chrome homepage and click on the Install button. This will launch the VS Code and start the installation for you automatically.
You can search this extension in the Extensions panel of VS Code and install it.
 Figure 13a: VS Code extension install
After installation, click on the Run option from the left and create a configuration to run/debug a JavaScript application.
 Figure 13b: Enable debugging with configuration
A file called launch.json will be created with some setting information in it. It may look like this:
{
  // Use IntelliSense to learn about possible attributes.
  // Hover to view descriptions of existing attributes.
  // For more information, visit: <https://go.microsoft.com/fwlink/?linkid=830387>
  "version": "0.2.0",
  "configurations": [
      {
          "type": "chrome",
          "request": "launch",
          "name": "Debug the Greet Me app",
          "url": "<http://localhost:5500>",
          "webRoot": "${workspaceFolder}"
      }
  ]
}
You may want to change the following parameters:
- name: Anything suitable for your app. It is optional to change.
- url: The URL that your app is running on locally.
- webRoot: By default, the value is ${workspaceFolder}, which is the current folder. You may want to change it to the entry point folder where a file like index.html is located.
The last step is to start the debugging by clicking the small play icon at the top-left corner.
 Figure 13c: Start debugging
Understanding debugger panels
VS Code provides similar tools to DevTools for debugging JavaScript. You will find lots of similarities with the Google Chrome JavaScript debugger we have seen so far in this article. Here are the primary sections you should be aware of:
- Enable debugging. Press the play button to enable the debugging option.
- Controls for stepping through the breakpoints and to pause or stop debugging. This is almost similar to the one we have seen with Chrome DevTools except some of the keyboard shortcuts may differ.
- Setting breakpoints on the source code. This is similar.
- The scope panel to see variable scopes and values. These are completely the same in both cases.
- The watch panel to create and watch expressions.
- The call stack of the execution function.
- The list of breakpoints to enable, disable, and remove.
- The debug console to read the console log messages.
Figure 13d: Anatomy of the VS Code debugging controls
A quick demo
Here is a quick demo(1 minute) to showcase the VS Code debugging control usages.
VS Code Debugging
Summary
To Summarize,
- It is always better to use a tool to debug JavaScript code. A tool like the Google Chrome
DevToolsorVS Codedebugger extension is much better than just relying on theconsole.log(). - DevTools
Source Panelis extremely powerful, with the capability to inspect variable values, watch expressions, understand scopes, read the call stack, etc. - There are several ways to set
breakpointsand we should use them based on the debugging situation. - Managing breakpoints is simple with
DevTools. - The
VS Code debuggerextension is equally powerful and a must-try.
That’s all for now. Thank you very much for reading through it, hope you find this article useful. Happy debugging! Please feel free to connect with me on Twitter(@tapasadhikary).


