
DevTools - My Favorite Tips and Tricks

Co-Founder, @CreoWis | Teacher, @tapaScript | Founder, @ReactPlay | YouTuber | Writer | Human
I was not so keen on publishing this article initially as I thought that I would be repeating the things that you might be knowing already. After all, it is all about using Browser's Dev Tool Efficiently. But later, I realized that each of us must be having our own favorite set of tips and tricks that are fine to boast about. Thus the article happened!
Statutory Warning:
To me, Web Browser's Dev Tool and
Chrome Browser's Dev toolare Synonyms.
Please note that I am not going to mention things like console.log('Hi'), how to debug Source files, or inspect the DOM. Most of you must be doing it day in and out. All that I mentioned below are least-used but can make you a very productive Web Developer. Let's get started.
Elements Panel
Following Tricks are related to the Elements tab of Chrome's Debugger Tool

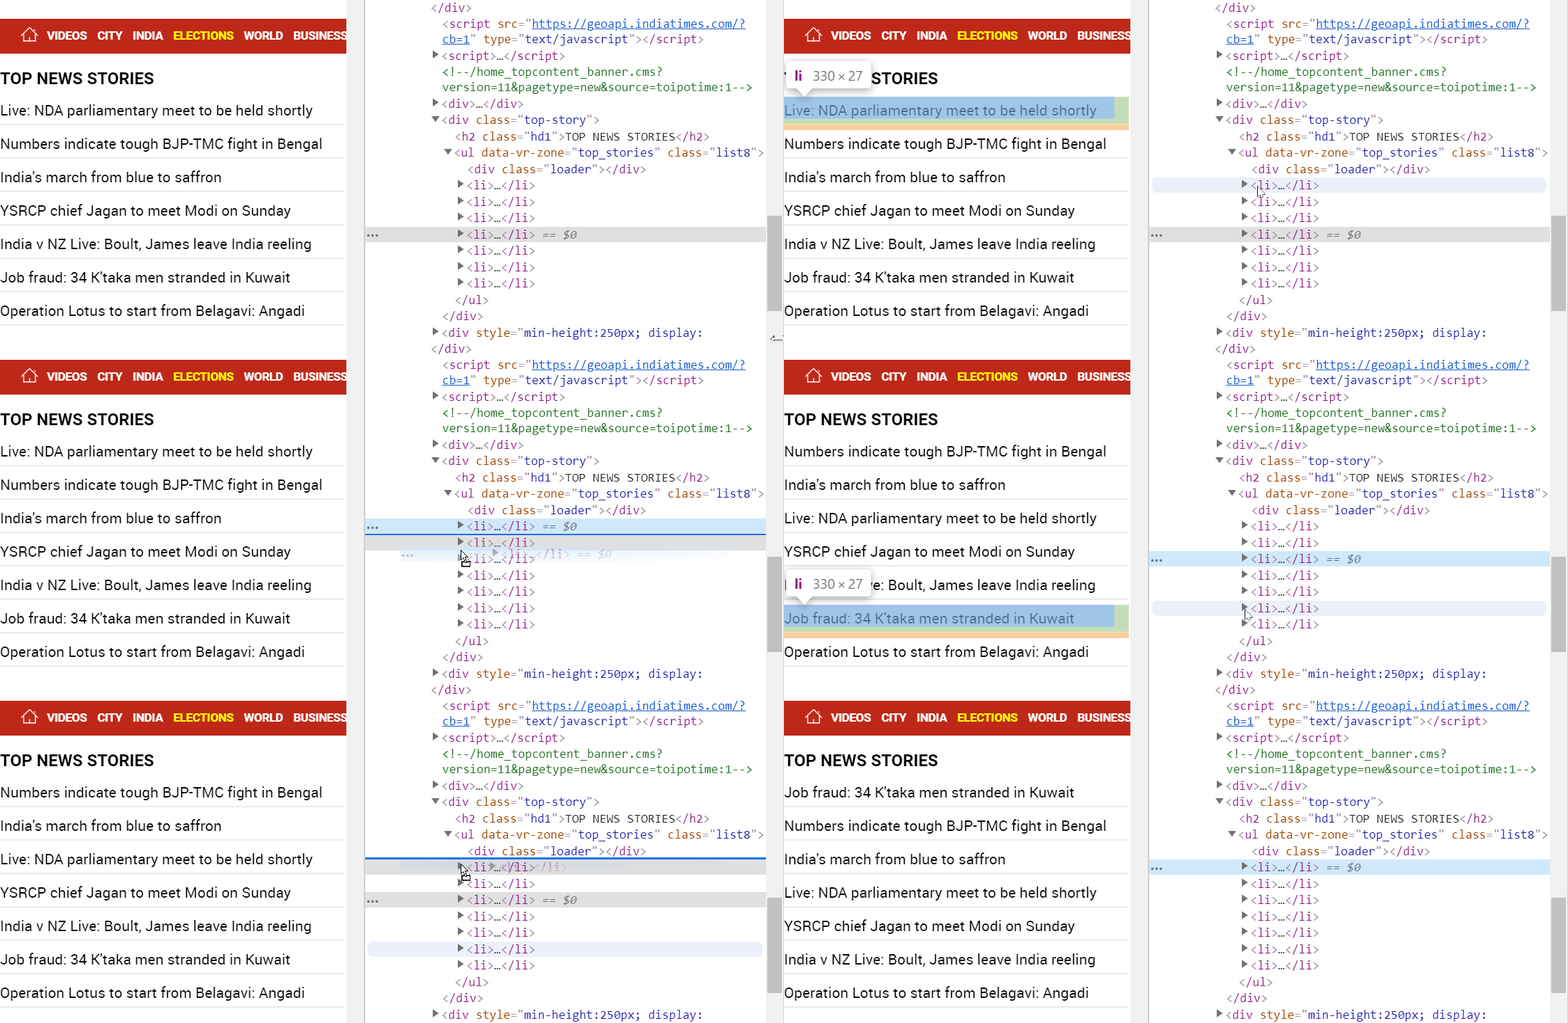
Re-arrange Position of Elements
You can Drag-and-Drop the elements to move Up-and-Down in position. This is very helpful while editing/debugging the HTML structure.
Reference a Node in Elements panel
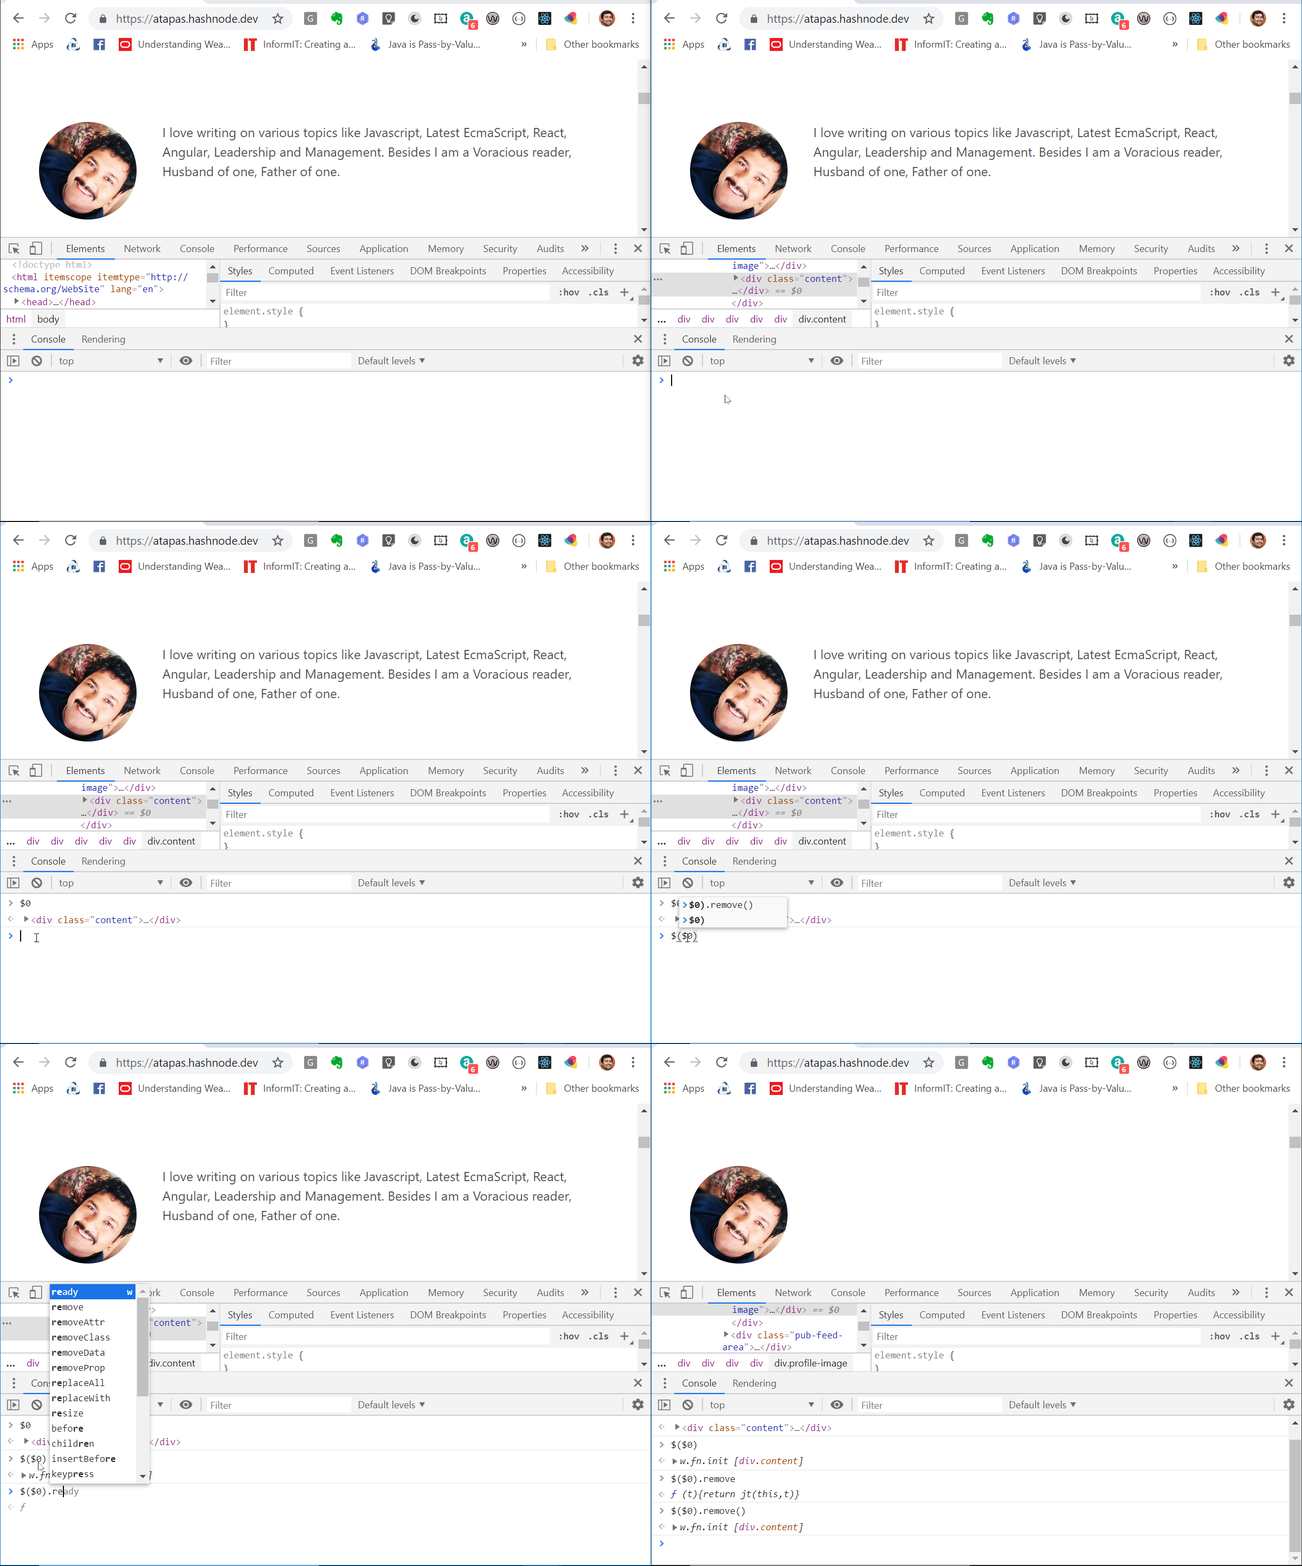
Do you have to select a particular Node in the Elements panel and refer to it from the Console panel? You may have if you want to do further processing(or debugging) on that Node.
Use $0 for it.
- Note: if you’re using jQuery in your project, you can use
$($0)to access and apply jQuery APIs on this element.
Doing lots with a single DOM Node, like taking a Screen Shot?
You can take a screenshot of a DOM node without going out of the Debugger tool. Yeah, Fancy! Press ctrl-shift-p(I think it is cmd-shift-p in Mac) by selecting a node. You will be given lots of options to select from. One of those is to take a Screen Shot, Really!
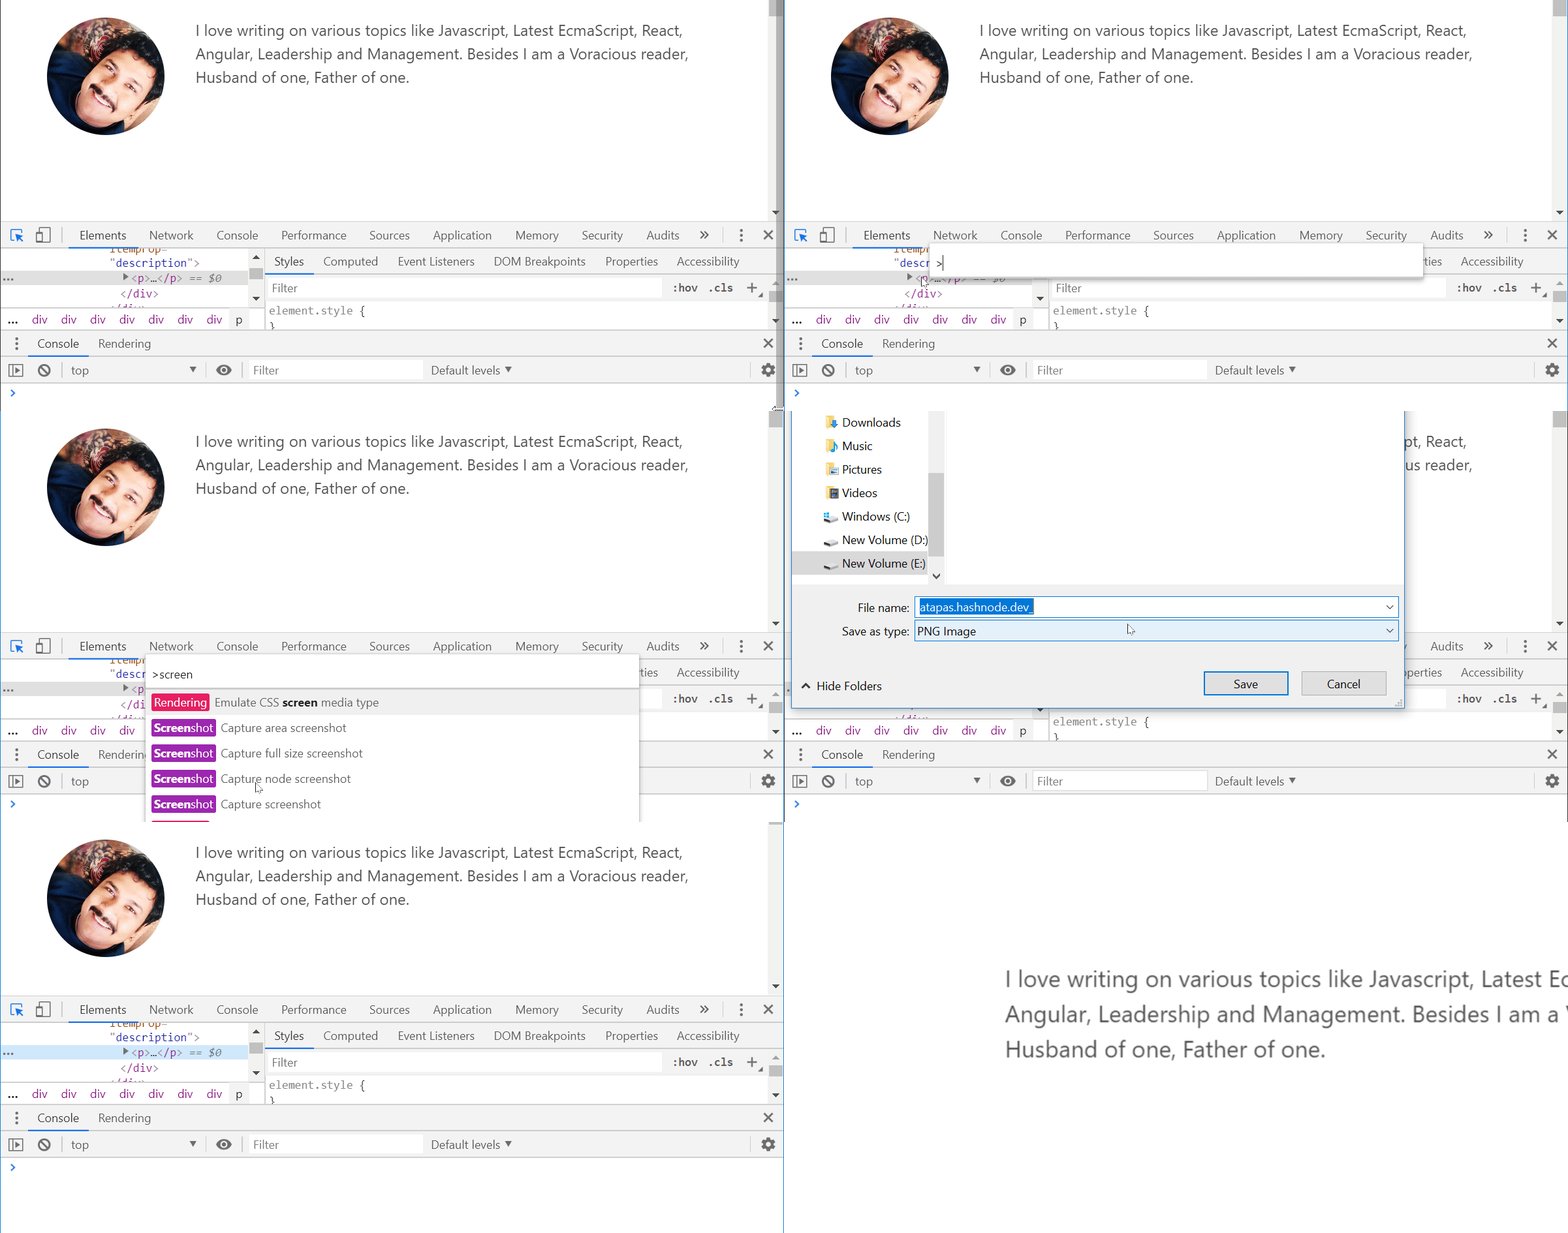
- Do not forget to explore other options available on pressing
ctrl-shift-pfor DOM Node.
Console Panel
This one is my favorite panel among all the available panels.

Go Multi-Line
It is annoying at times to type multi-lines in the console panel. You can do it just by pressing shift-enter key combinations. Keep pressing shift-enter to continue with the execution for each line. Once done, press the enter key.

Console logs Formatting
If we go beyond the simple console.log('Hi'), there are few more useful versions of it for better formatting:
- %s format a variable as a string
- %d format a variable as an integer
- %f format a variable as a floating-point number
- %o can be used to print a DOM Element
- %O used to print an object representation
- %c used to pass CSS to format a string
Let's see some of these as example below:
console.log(
  '%c I have %d %s',
  'color: green; background:black; font-size: 20pt',
  3,
  'Bikes!'
)
Run the above code in the console panel. You will see an output as,

Store as Global Variable
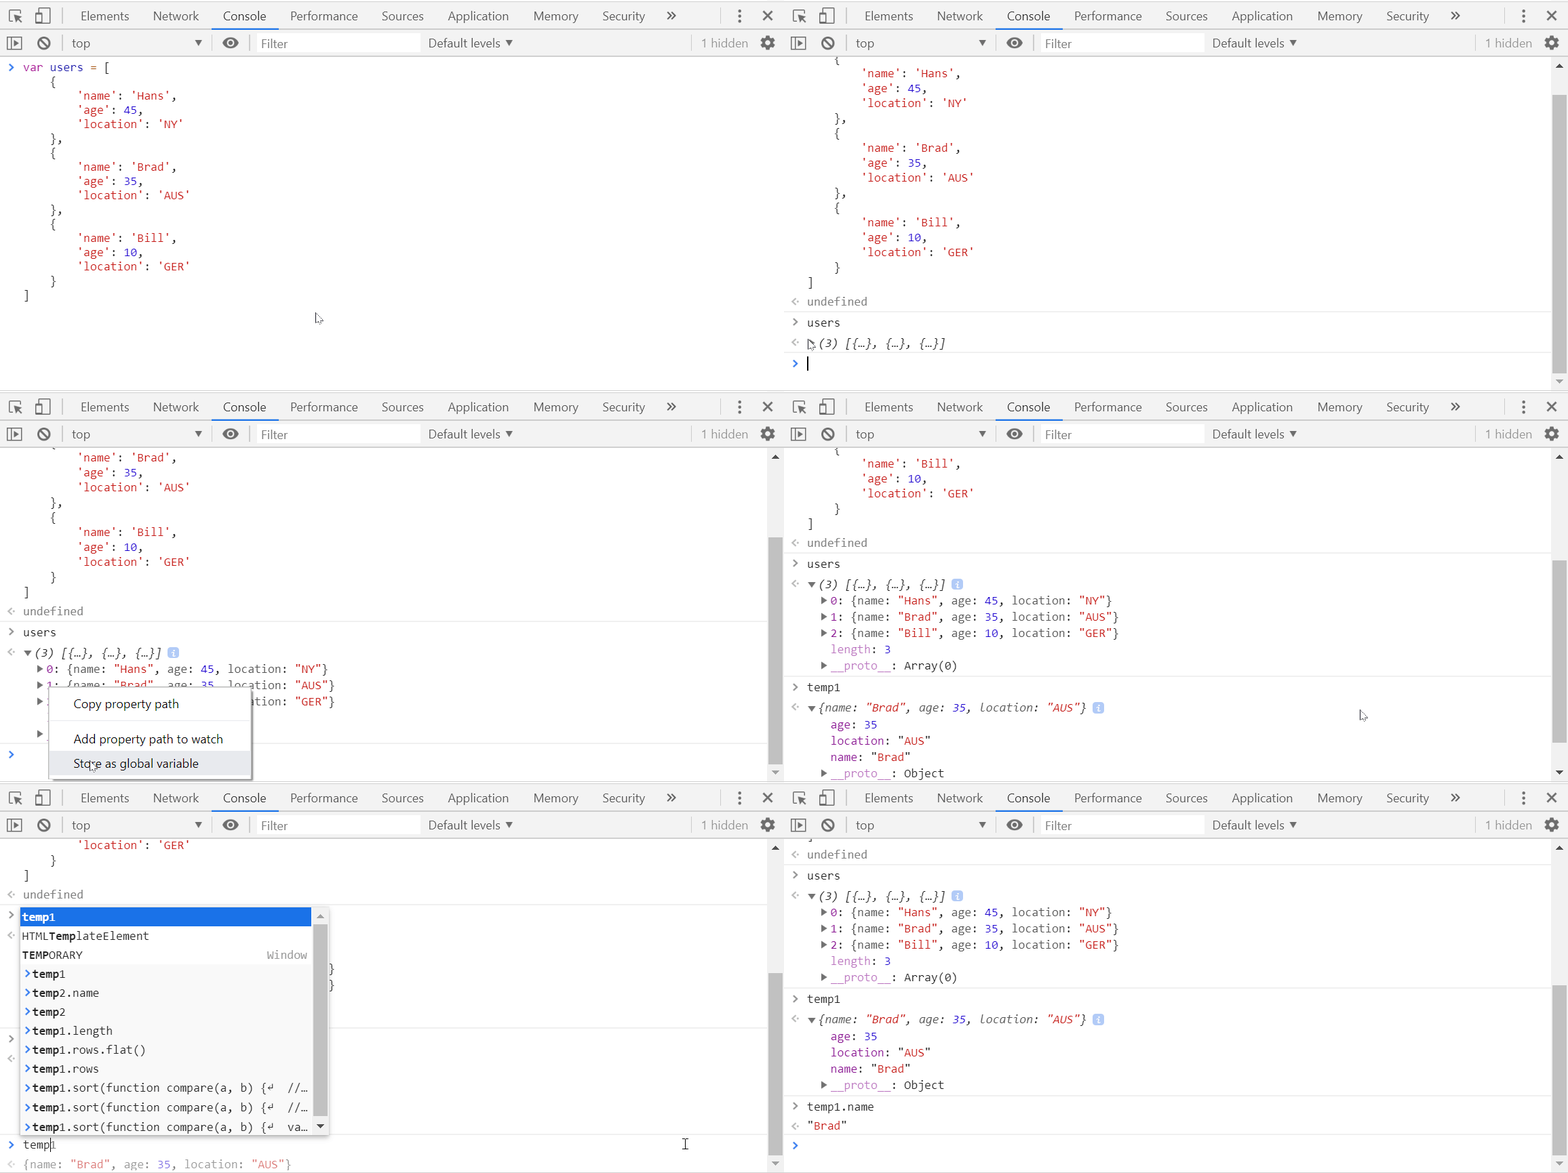
Often we get a bigger chunk of a JSON object as a response. We might want to pick a portion of it and work on it. There is a way to save any portion of the JSON object as a Global Temporary Variable that can be accessed in the console panel. See it now:
Advanced Logging in the Console panel
console.dir
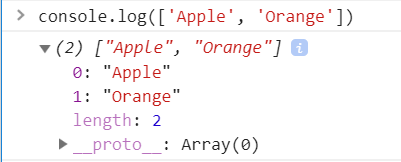
console.log(['Apple', 'Orange]);
Output is,
Now try,
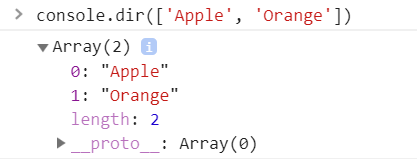
console.dir(['Apple', 'Orange'])
The output is almost the same as above but, it explicitly says the type as an Array.
console.table
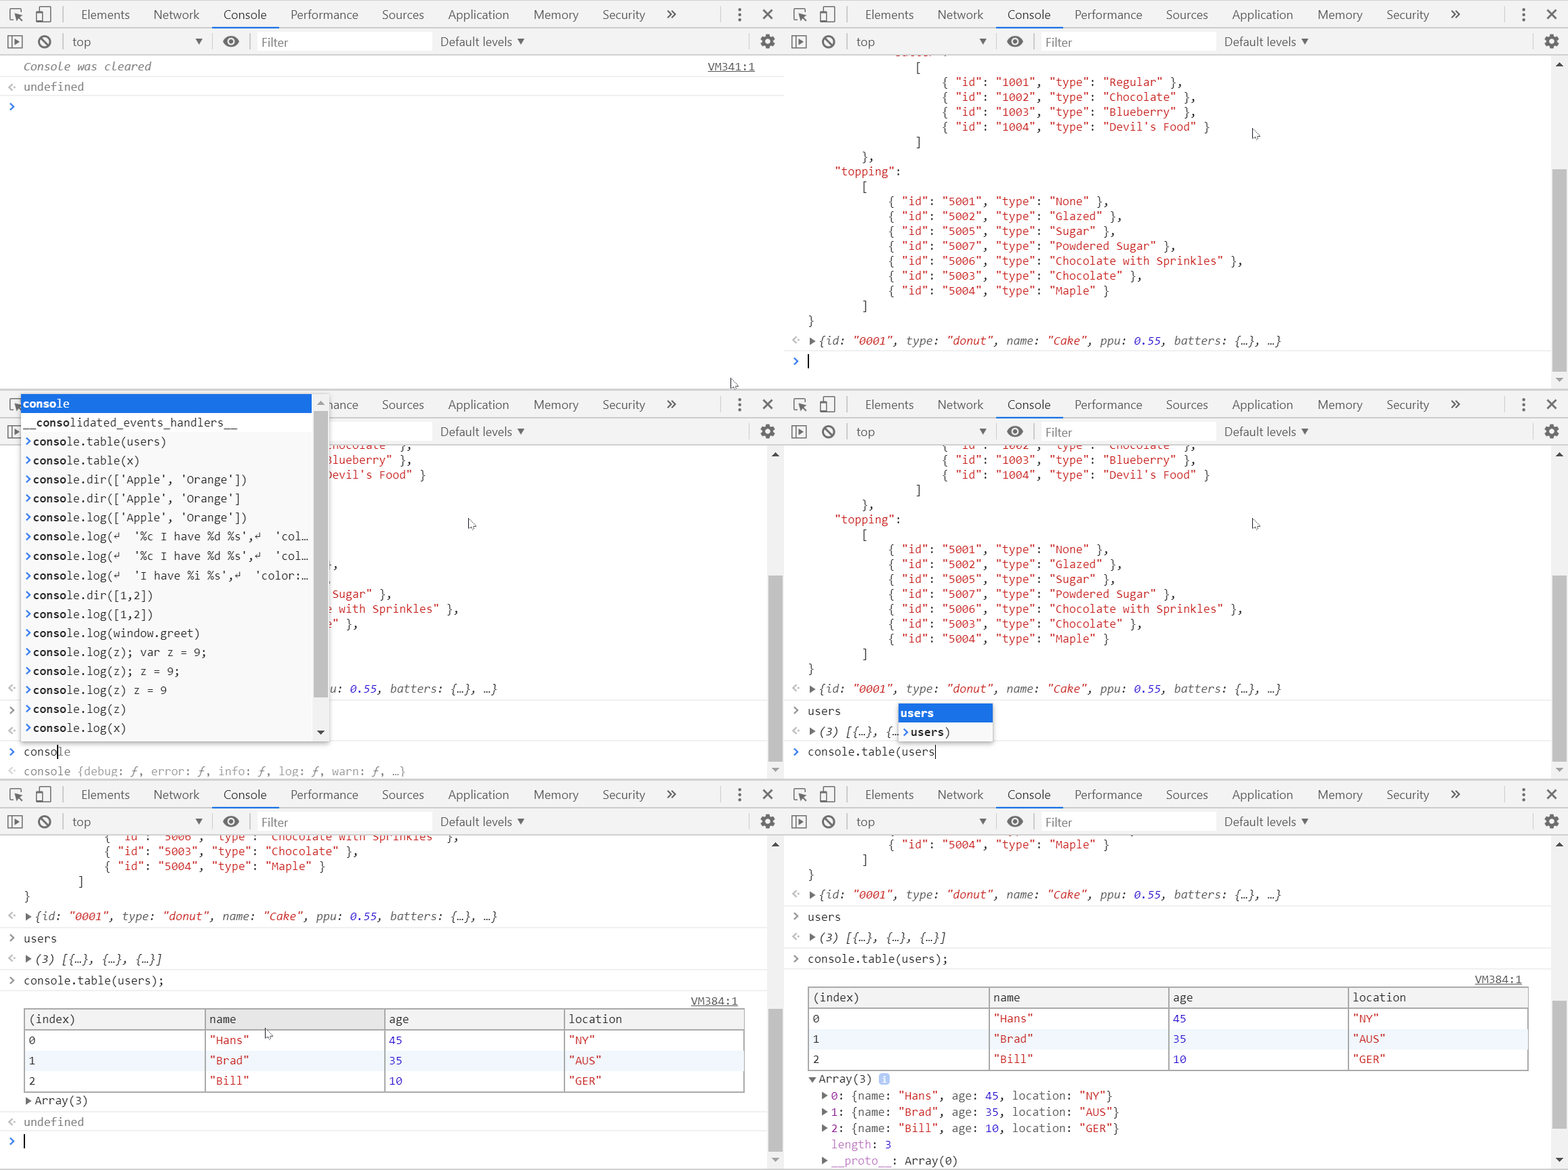
This prints a Table representation in the console. It is mighty when you deal with a complex object. Just print it as a tabletop view and inspect it with ease. See it in action:
Preserver Console Logs
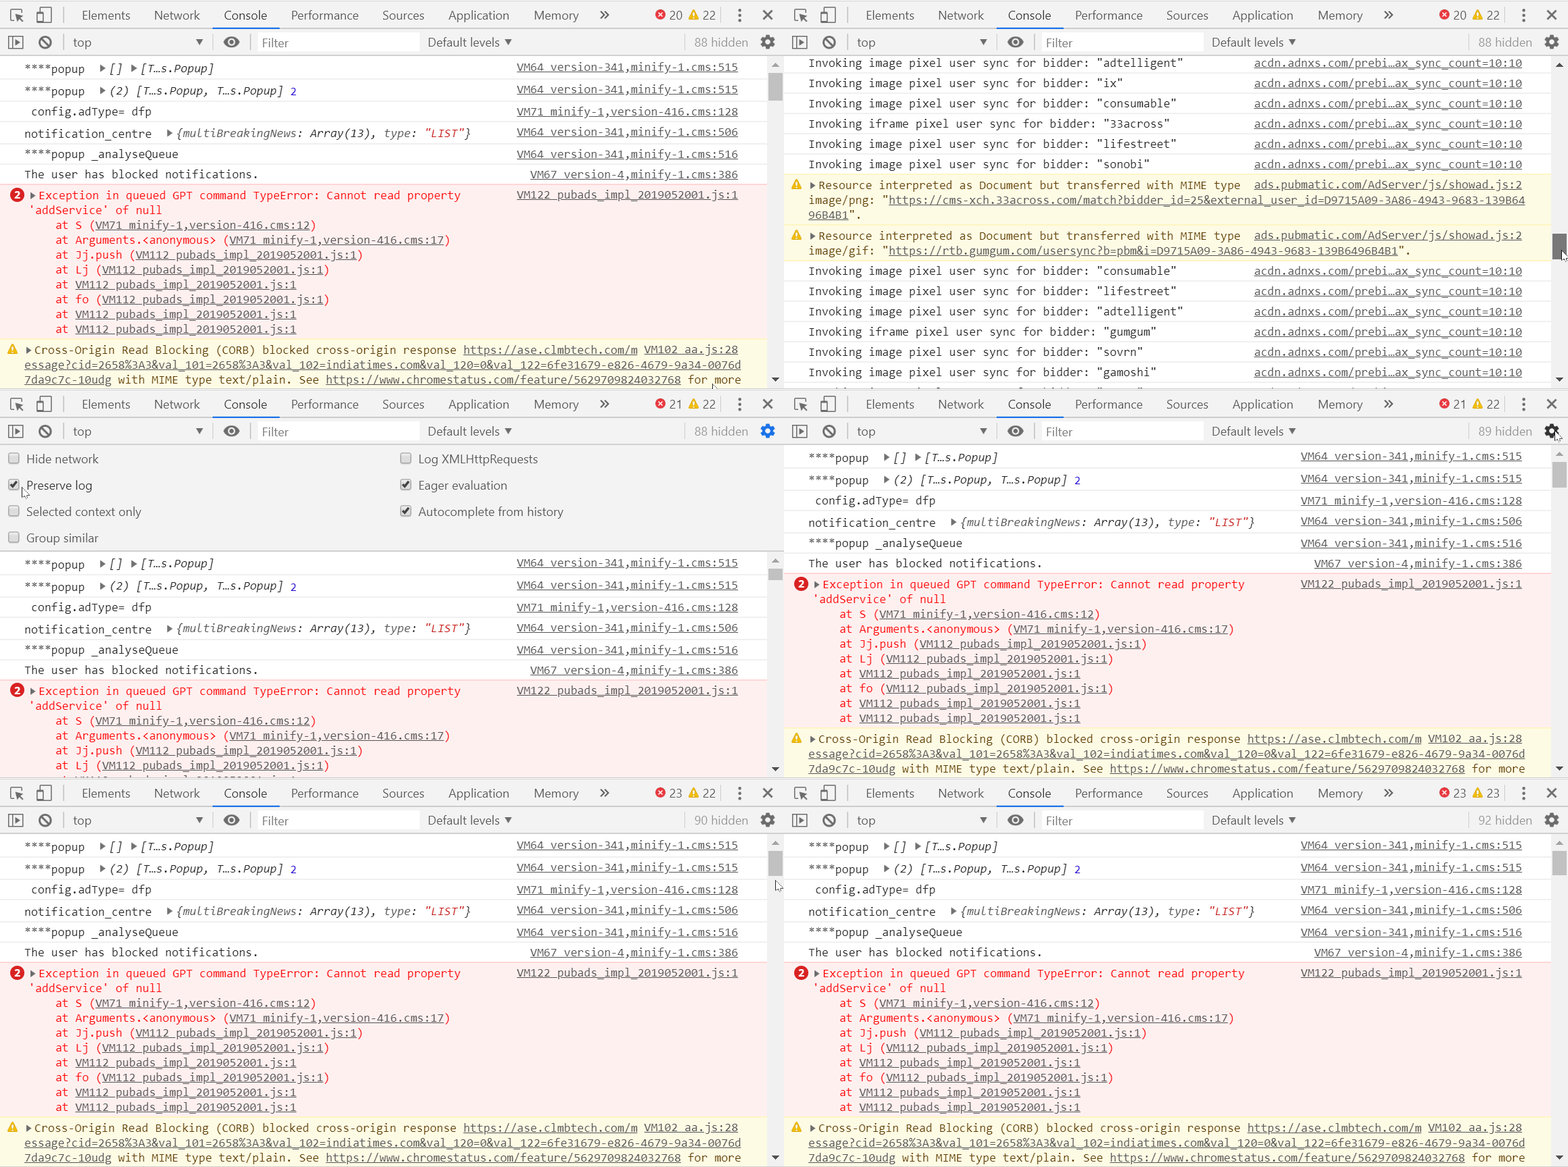
Isn't it annoying that the logs in the console get cleared of on Navigating to other pages? You can preserve those just by checking a check-box:
Grouping Console logs
At times, keeping the logs loose can cause delays in debugging. Consider a situation that, you want to group all the logs together for a function and do not want it to be mixed with other log messages. Yes, you can do it easily.
console.group('Testing my calc function');
console.log('adding 1 + 1 is', 1 + 1);
console.log('adding 1 - 1 is', 1 - 1);
console.log('adding 2 * 3 is', 2 * 3);
console.log('adding 10 / 2 is', 10 / 2);
console.groupEnd();
`
The output is a grouped log together:
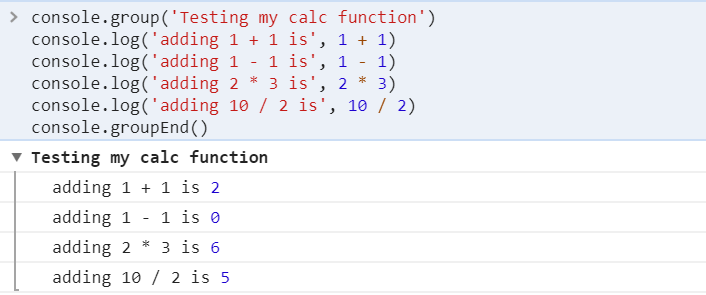
You can really go as nested as you want. The use of console log grouping is highly recommended.
It is time for console.time
Often you will find a need to measure how long a function takes to execute? How long a block of code takes to execute? console.time() and console.timeEnd() are very useful utilities to help here. Here is an example of calculating the time it takes to get the last name of billion objects(I have just mimicked the billion!)
function test time() {
  var users= [
    {
      firstname: "Tapas",
      lastname: "Adhikary",
      hobby: "Blogging"
    },
    {
      firstname: "David",
      lastname: "Williams",
      hobby: "Chess"
    },
    {
      firstname: "Brad",
      lastname: "Crets",
      hobby: "Swimming"
    },
    {
      firstname: "James",
      lastname: "Bond",
      hobby: "Spying"
    },
    {
      firstname: "Steve",
      lastname: "S",
      hobby: "Talking"
    }
  ];

  var getName = function (user) {
    return user.lastname;
  }

  // Start the time which will be bound to the string 'loopTime'
  console.time("loopTime");

  for (let counter = 0; counter < 1000 * 1000 * 1000; counter++) {
    getName(users[counter & 4]);
  }

  // End the time tick for 'loopTime
  console.timeEnd("loopTime");
}
Once you run the above code from the console panel or within the node environment, you will be getting the output like,
loopTime: 2234.032958984375ms
That's the total time taken in milliseconds to compute the last name of billion Users. Great!
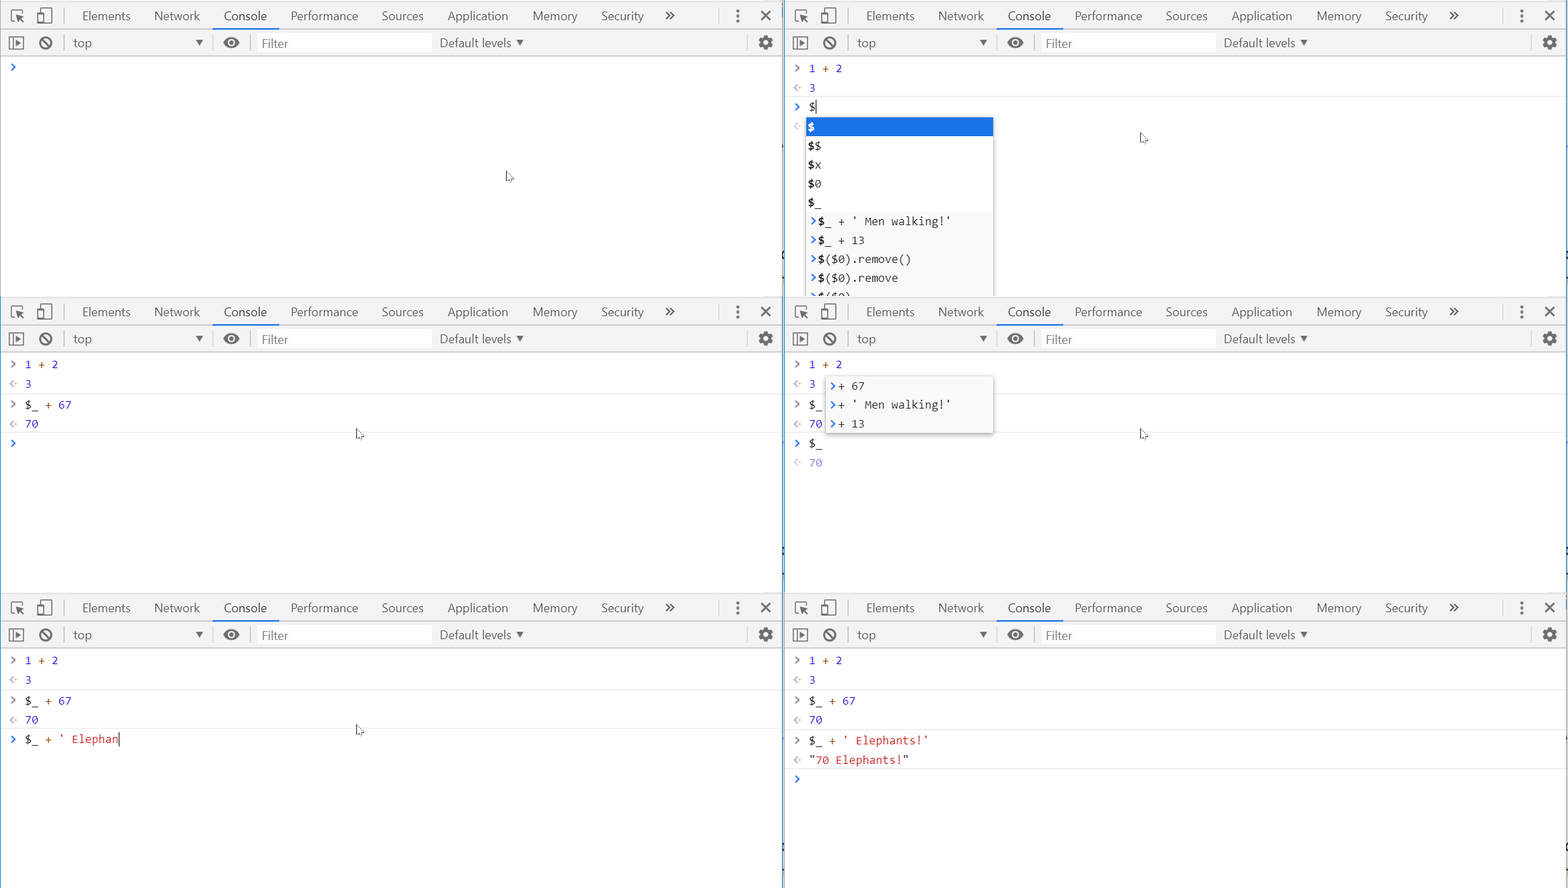
$_ Refer to previous execution output
When you are in the console panel, you can refer to the previous execution output with $_. You can feed this output as an input to your next execution logic.
This is just a small set that I am in love with. There are plenty of other panels to cover as well. You can find the full list from Google's Tools for Web Developers. It surely deserves a book-mark in your favorite browser.
I would love to hear from you on your favorite set. As they say, 'Sharing is Caring, please share some by posting a comment below.
 Image Courtesy: GIPHY.com
I hope you liked this post. Please hit the Follow button below to read my future articles. Happy Exploring!


